Glycemic Load vs. Glycemic Index: How Everyday Meals Affect Your Blood Sugar
On April 17, 2026, my glucometer read 420 mg/dL. My HbA1c was 14.2%. As a physician who has spent years on the prescribing side of metabolic disease, I was now sitting on the other side of that desk — and I had a decision to make.
I chose not to take medication. Instead, I went back to the science. I studied every variable that was spiking my blood sugar: sleep, stress, exercise timing, and most critically, food. Specifically, I needed to understand not just what I was eating, but how much of a glucose response each meal was actually generating.
That investigation led me deep into two numbers that most people either confuse or misuse: the Glycemic Index (GI) and the Glycemic Load (GL).
Understanding the difference between them — and learning to use GL instead of just GI — was one of the cornerstones of how I lowered my HbA1c from 14.2% to 5.3% in 75 days without medication.
This post is the educational guide I wish someone had handed me that night.
What Is the Glycemic Index? (And Why It Is Only Half the Story)
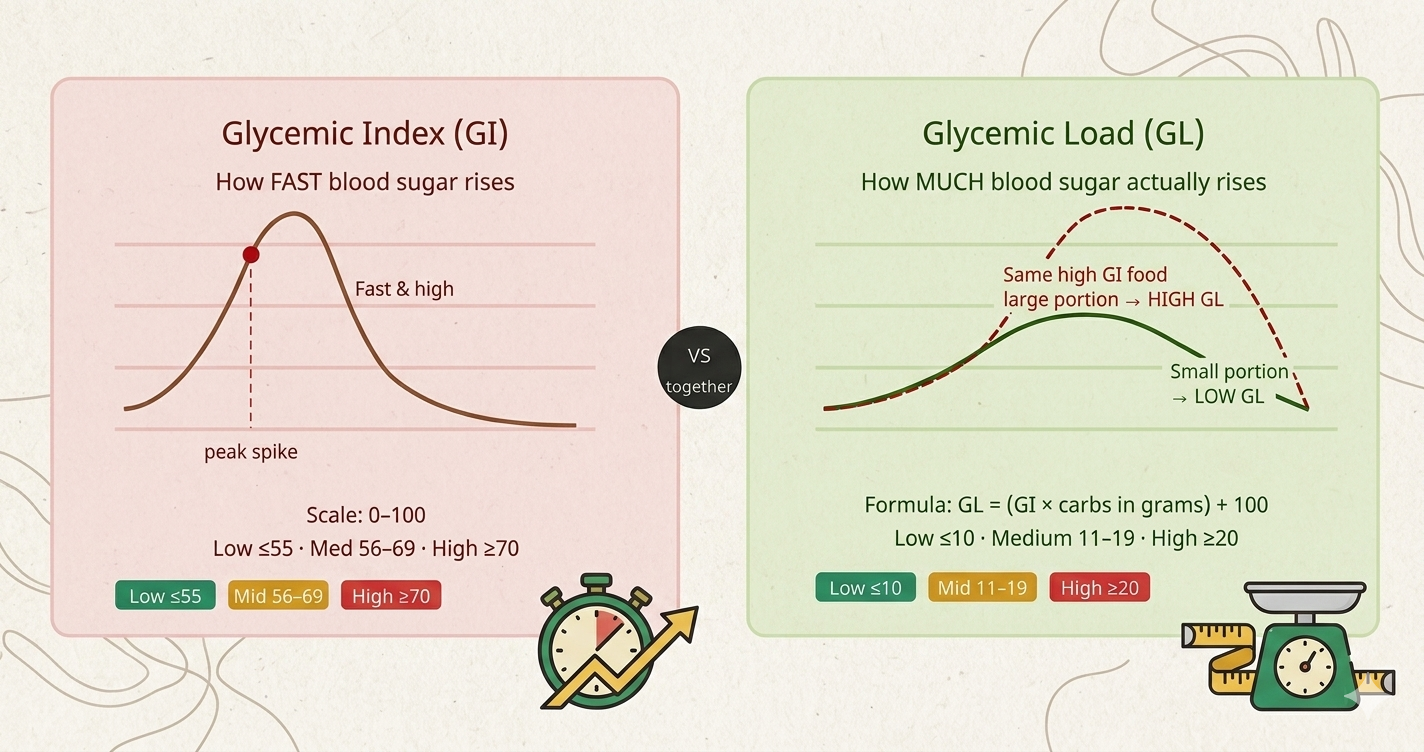
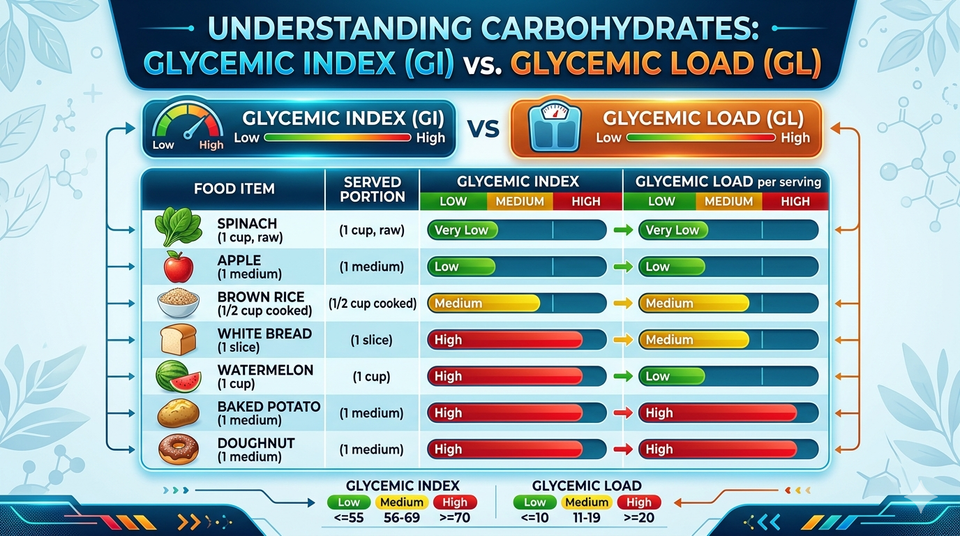
The Glycemic Index is a ranking system, scored from 0 to 100, that measures how quickly the carbohydrates in a specific food raise your blood glucose compared to pure glucose (which scores 100). The higher the number, the faster and more aggressively that food spikes your blood sugar.
The classification works like this:
- Low GI (55 or below): Slow, gradual glucose release. Examples: oats, lentils, most fruits.
- Medium GI (56–69): Moderate spike. Examples: brown rice, whole wheat bread, sweet potato.
- High GI (70 and above): Rapid, sharp spike. Examples: white bread, cornflakes, baked white potato.
This scale, developed by Dr. David Jenkins at the University of Toronto in 1981, was a genuine breakthrough. For the first time, clinicians and patients had a scientific way to compare how different carbohydrates behave inside the body. Harvard Health describes it as a useful guide for identifying foods less likely to cause rapid blood sugar swings.
But here is the problem. The GI is calculated using a 50-gram carbohydrate portion of each food eaten in isolation. In real life, you rarely eat 50 grams of carbohydrate from a single food, alone, with nothing else.
That is where GI falls apart — and where glycemic load steps in.
What Is Glycemic Load? (The Number That Actually Matters)
Glycemic Load takes the GI concept and adds the one thing it was missing: how much carbohydrate you actually eat in a real serving.
The formula is straightforward:
GL = (GI × grams of available carbohydrate per serving) ÷ 100
Classification:
- Low GL (10 or below): Minimal blood sugar impact.
- Medium GL (11–19): Moderate impact, manageable with good meal composition.
- High GL (20 and above): Significant blood sugar impact.
According to research from the Linus Pauling Institute at Oregon State University, GL is a more powerful predictor of postprandial (after-meal) insulin response than GI alone, because it accounts for both the quality of the carbohydrate and the quantity consumed.
Put simply: GI tells you how fast a car can go. GL tells you how far it actually travelled.
The Watermelon Paradox: Why GI Alone Is Misleading
This is the example I use with every patient — and it is the clearest demonstration of why GI without GL can lead you badly astray.
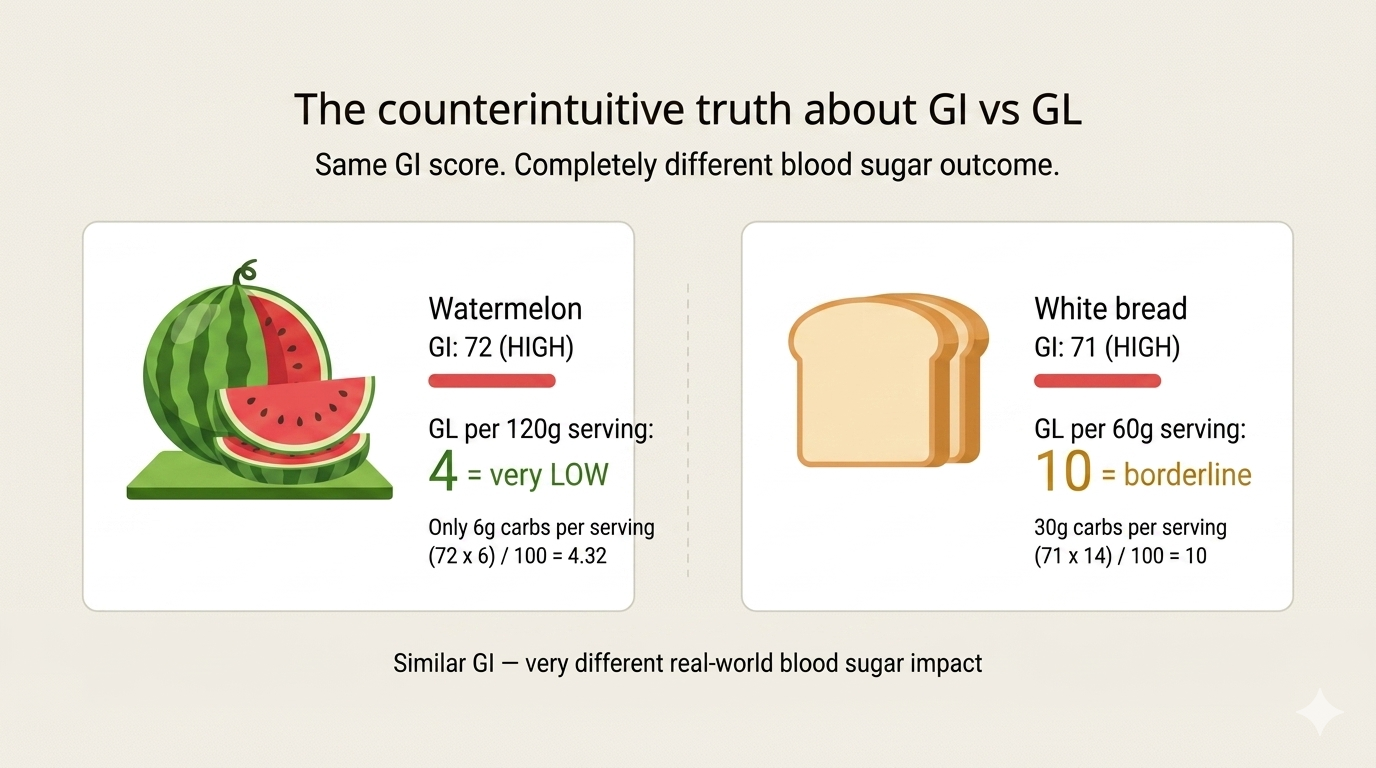
Watermelon has a GI of 72. By the GI scale, that puts it firmly in the "high" category, right alongside white bread and cornflakes. For years, people with diabetes were told to avoid it.
But here is what the GI number does not tell you: a standard 120g serving of watermelon contains only about 6 grams of available carbohydrate. When you run the GL formula:
GL = (72 × 6) ÷ 100 = 4.3 — firmly LOW.
Watermelon, despite its fearsome GI number, delivers a negligible glucose hit in any reasonable portion. You would need to eat roughly 1.5 kg of it in one sitting to generate a genuinely high glycemic load.
The same paradox applies to carrots (GI: 35–47, GL per 80g serving: just 2) and parsnips (GI: 52, GL: 4). These are foods that have historically been branded as "bad for blood sugar" based on GI alone — which is simply not accurate when you account for the actual carbohydrate content of a normal portion.
The reverse is equally true, and more dangerous. Spaghetti has a relatively modest GI of 46 — squarely in the "low" category. Many people interpret this as a green light for large portions. But a standard 180g serving of white spaghetti contains about 48 grams of carbohydrate. The GL calculation:
GL = (46 × 48) ÷ 100 = 22 — HIGH.
A large plate of pasta — even al dente, even whole wheat — can carry a glycemic load that rivals white bread. The fork-twirling portion matters as much as the food itself.
The Reference Table: GI and GL of Everyday Western Meals
The data in this table is drawn from the peer-reviewed International Tables of GI and GL Values (Atkinson, Foster-Powell & Brand-Miller, American Journal of Clinical Nutrition) and the University of Sydney Glycemic Index Database — the world's most authoritative GI reference.
| Food | Serving | GI | Carbs (g) | GL | Rating |
|---|---|---|---|---|---|
| GRAINS & STARCHES | |||||
| White rice | 150g (¾ cup cooked) | 89 | 43 | 43 | 🔴 HIGH |
| Brown rice | 150g (¾ cup cooked) | 50 | 32 | 16 | 🟡 MEDIUM |
| White spaghetti (al dente) | 180g (1 cup cooked) | 46 | 48 | 22 | 🔴 HIGH |
| Wholemeal spaghetti | 180g (1 cup cooked) | 42 | 40 | 17 | 🟡 MEDIUM |
| Couscous | 150g (¾ cup cooked) | 65 | 35 | 9 | 🟢 LOW |
| Pearled barley | 150g (¾ cup cooked) | 28 | 38 | 12 | 🟡 MEDIUM |
| BREADS | |||||
| White bread (2 slices) | 60g | 71 | 30 | 10 | 🟢 LOW* |
| Whole wheat bread (2 slices) | 60g | 71 | 26 | 9 | 🟢 LOW* |
| Sourdough (2 slices) | 60g | ~52 | 27 | ~14 | 🟡 MEDIUM |
| White bagel | 70g | 72 | 35 | 25 | 🔴 HIGH |
| Pumpernickel (2 slices) | 60g | 56 | 24 | 7 | 🟢 LOW |
| BREAKFAST CEREALS | |||||
| Cornflakes | 30g (1 cup) | 93 | 25 | 23 | 🔴 HIGH |
| Instant oatmeal | 250g (1 packet) | 83 | 26 | 30 | 🔴 HIGH |
| Rolled oats / porridge | 250g (1 bowl) | 55 | 21 | 13 | 🟡 MEDIUM |
| Steel-cut oats | 250g (1 bowl) | 52 | 22 | 12 | 🟡 MEDIUM |
| All-Bran | 30g (½ cup) | 55 | 15 | 12 | 🟡 MEDIUM |
| POTATOES | |||||
| Baked russet potato | 150g | 111* | 30 | 33 | 🔴 HIGH |
| Boiled white potato | 150g | 82 | 21 | 21 | 🔴 HIGH |
| Sweet potato (boiled) | 150g | 70 | 28 | 22 | 🔴 HIGH |
| Potato (boiled then cooled) | 150g | ~49 | 21 | ~11 | 🟡 MEDIUM |
| FRUITS | |||||
| Watermelon | 120g | 72 | 6 | 4 | 🟢 LOW |
| Banana (ripe) | 120g | 62 | 24 | 16 | 🟡 MEDIUM |
| Apple | 120g | 39 | 15 | 6 | 🟢 LOW |
| Orange | 120g | 40 | 11 | 4 | 🟢 LOW |
| LEGUMES | |||||
| Lentils | 150g | 29 | 18 | 5 | 🟢 LOW |
| Chickpeas | 150g | 10 | 25 | 3 | 🟢 LOW |
| Kidney beans | 150g | 29 | 25 | 7 | 🟢 LOW |
| Baked beans | 150g | 40 | 15 | 6 | 🟢 LOW |
Note: A GI above 100 is possible — it means the food raises blood sugar faster than pure glucose, due to factors like starch structure. White bread GL appears low at 2 slices; the danger comes from larger portions or piling high-GL toppings.
The Cooking Method That Changes Everything
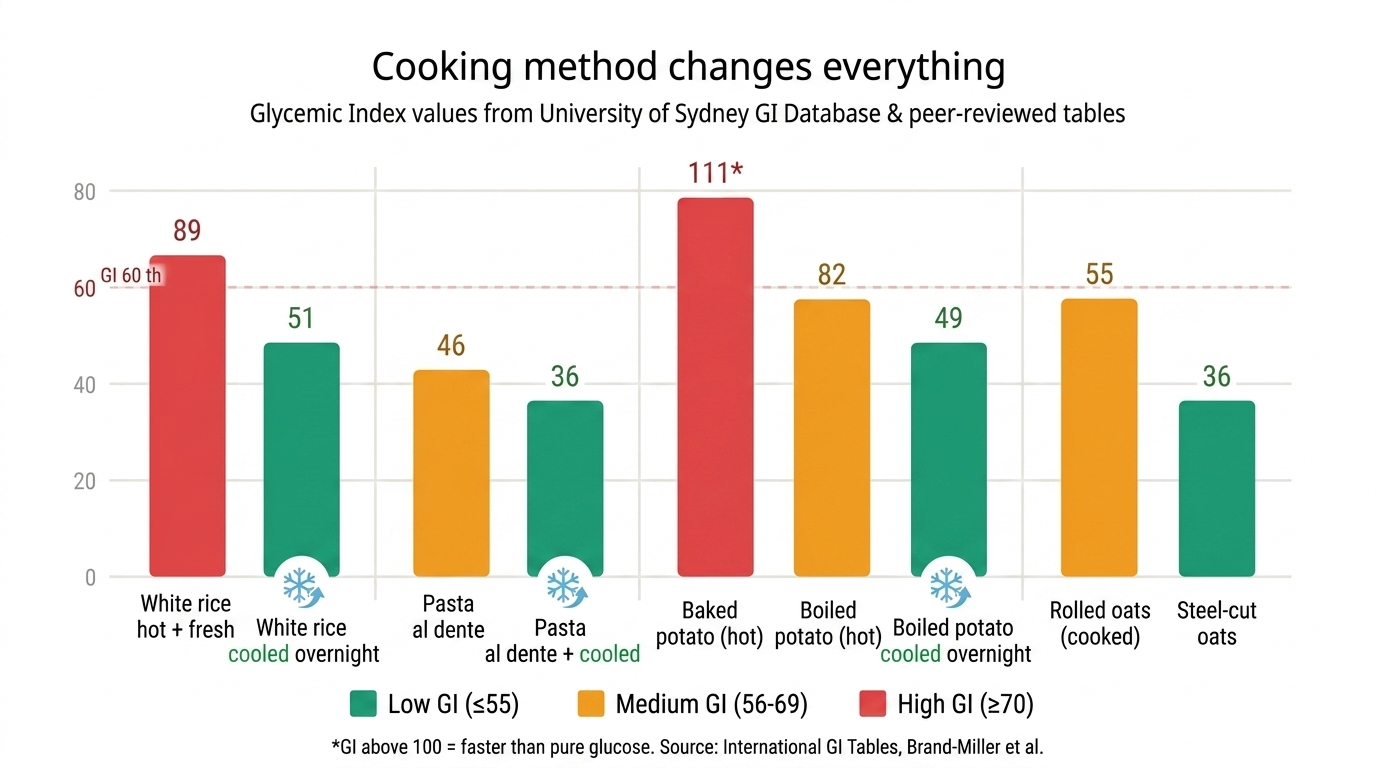
One of the most clinically useful — and underreported — facts in the GI/GL world is that how you cook and serve food dramatically changes its glycemic impact.
Rice
In a 2025 study published in PMC using ISO 2010 standards, researchers confirmed that cooking method and rice type create significant variation in glycemic response. Short-grain white rice cooked soft and eaten hot carries one of the highest GI values of any common food (up to 89). However, cooking rice and then cooling it overnight increases its resistant starch content, which is digested more slowly and generates a substantially lower blood glucose response — dropping GI by an estimated 25–35%.
The practical implication: yesterday's cold rice from the fridge is genuinely better for your blood sugar than freshly cooked rice. This is not a diet trick. It is a structural change in the starch molecule itself.
Pasta
Pasta cooked al dente (firm, slightly undercooked) has a GI around 46. The same pasta boiled soft for 20 minutes climbs to 61. The longer the cooking time, the more the starch gelatinises — and the faster your gut absorbs it. This is why Italian-style pasta, traditionally cooked firm, has long been associated with better metabolic outcomes than the soft, overcooked versions common in the US and UK.
Potato
The potato data is striking. A freshly baked russet potato has a GI of 111 — higher than pure glucose. The same potato, cooked and then cooled, drops to around 49 due to resistant starch formation. Potato salad made with cooled boiled potatoes, despite adding mayonnaise, can actually carry a more modest glycemic response than a freshly baked potato served hot.
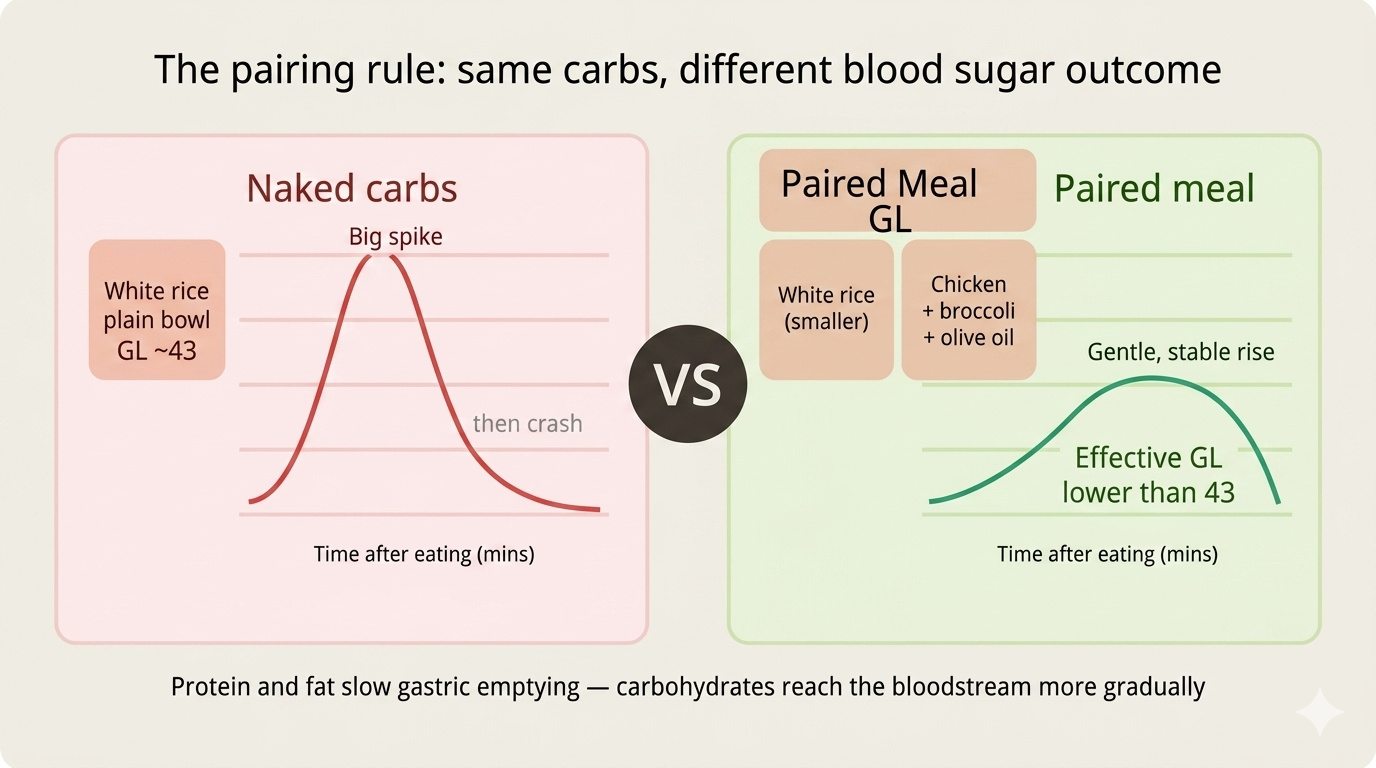
The Single Most Effective Meal Strategy: The Pairing Rule
Even with the best food choices, the order and combination of what you eat matters profoundly. Research from Abbott's Lingo CGM programme and multiple clinical trials confirm that pairing carbohydrates with protein, fat, or fibre significantly lowers the glycemic load of the entire meal — not just the individual food.
The mechanism: protein and fat slow gastric emptying, meaning carbohydrates trickle into your small intestine more slowly and produce a smaller, more gradual glucose curve. Soluble fibre creates a physical gel in the gut that acts as a buffer against rapid glucose absorption.
In practical terms, this means:
White rice + plain → High GL, rapid spike.
White rice + grilled chicken + steamed broccoli + olive oil → The effective GL of the entire meal is substantially lower.
This is also the exact meal-sequencing protocol I used during my own reversal — eating vegetables and protein first, carbohydrates last. Studies show this sequence alone can reduce postprandial blood sugar by 20–30%.
Here is a simple rule of thumb for building every meal:
- Start with fibre — non-starchy vegetables, salad, cucumber.
- Add protein — chicken, fish, eggs, legumes.
- Add fat — olive oil, avocado, a small handful of nuts.
- Eat carbohydrates last — and choose the lowest GL option available.
Breakfast: The Meal Where GL Matters Most
For most people, breakfast is the highest-GL meal of the day — and the one causing the most damage to morning fasting numbers. Let me compare four typical Western breakfasts using the data from the table above:
Option A: Cornflakes with semi-skimmed milk
Cornflakes (30g): GL 23. Add milk (250mL, GL ~4). Total GL: ~27. High. You have delivered a significant glucose hit before 9am with almost no protein or fat to slow it down.
Option B: Two slices of white toast with butter and eggs
White bread (60g): GL ~10. Eggs: GL 0. Butter: GL 0. Total GL: ~10. Low-to-medium — and with the fat from butter and protein from eggs, the effective glycemic response of the whole meal is blunted further.
Option C: Instant oatmeal with sugar and milk
Instant oats (250g): GL 30. High — instant oats are heavily processed and behave very differently to steel-cut or rolled oats.
Option D: Steel-cut oats with berries and a tablespoon of almond butter
Steel-cut oats (250g): GL 12. Berries: GL 3–5. Almond butter: GL ~0. Total: ~15. Medium — and the fat and fibre in the almond butter lower the effective spike substantially.
The lesson from this comparison is not that you must eat the same breakfast every day. It is that small substitutions — instant oats to steel-cut, sugary cereal to eggs and toast, adding a protein source — carry a measurable and meaningful impact on your blood sugar for the rest of the morning.
What I Eat Now (And Why the GL Framework Made It Simple)
I am no longer tracking every gram compulsively. At 5.3% HbA1c and with metabolic flexibility restored, I use three simple rules that come directly from the GL framework:
Rule 1: No naked carbs. Every carbohydrate I eat is paired with a protein or fat. No plain toast, no plain rice, no plain fruit on its own.
Rule 2: Cool my starches. When I eat rice or potato, I prefer it cooked and cooled — the resistant starch benefit is real and requires zero extra effort.
Rule 3: Choose density over volume. Instead of asking "is this low GI?" I ask "how many grams of carbohydrate am I actually eating?" A small bowl of brown rice carries a reasonable GL. A large bowl of brown rice does not.
These rules were not invented by me. They emerge directly from the evidence — from the ADA 2026 Standards of Care, the international GI tables, and from the CGM data I generated during my own 75-day experiment. They are evidence-based, they are practical, and they are sustainable.
Frequently Asked Questions
Is glycemic load more important than glycemic index?
For practical meal planning, yes. GI tells you how fast a carbohydrate acts. GL tells you how much of that action actually occurs in the portion you eat. For managing blood sugar day to day, GL is the more actionable number. That said, using both together gives you the fullest picture.
What is a safe daily glycemic load total?
A total daily GL of 100 or below is generally considered low-glycemic. Most Western diets deliver a daily GL of 160–250. During my active HbA1c reversal phase, I targeted a daily total below 60 — which required strict meal discipline. In maintenance, I stay comfortably around 80–100.
Can I eat white rice if I have diabetes or prediabetes?
This depends entirely on portion size, preparation method, and what you eat it with. A small portion (100g) of cooled, cooked white rice eaten alongside protein and vegetables carries a very different glycemic load to a large, freshly cooked, plain bowl. Context is everything. Never apply GI rules to foods in isolation from the rest of the meal.
Is sourdough bread better for blood sugar than white bread?
Yes, generally. The fermentation process in authentic sourdough produces organic acids that slow starch digestion and lower the effective GI to approximately 52 — compared to white bread at 71. However, the difference in GL between two slices of each is modest. Portion size still matters more than the bread type for the overall glucose impact.
Does the order in which I eat food affect blood sugar?
Consistently, yes. Multiple randomised controlled trials show that eating vegetables and protein before carbohydrates reduces postprandial glucose peaks by 20–30%. This "food sequencing" approach costs nothing, requires no special food, and is one of the most underused tools in blood sugar management.
Medical Disclaimer
The information in this post is educational in nature and is based on published, peer-reviewed evidence. It reflects my personal clinical knowledge and my own experience as a patient. It is not a substitute for personalised medical advice. If you have diabetes, prediabetes, or any metabolic condition, please work with your physician or registered dietitian before making significant dietary changes.
Want to read the full story of how I used these principles — alongside intermittent fasting and structured exercise — to go from a 14.2% to a 5.3% HbA1c in 75 days? Read my full reversal story here.
Sources:
- Atkinson FS, Foster-Powell K, Brand-Miller JC. International Tables of GI and GL Values. American Journal of Clinical Nutrition, 2021.
- Linus Pauling Institute, Oregon State University. Glycemic Index and Glycemic Load. 2026.
- Harvard Health Publications. The Lowdown on Glycemic Index and Glycemic Load. 2025.
- University of Sydney Glycemic Index Research Service (SUGiRS). glycemicindex.com.
- Diabetesnet.com. Glycemic Index & Glycemic Load Practical Guide 2026. March 2026.
- Mayo Clinic. Low-Glycemic Index Diet: What's Behind the Claims? 2025.
- Abbott Lingo. Glycemic Load vs. Glycemic Index for Glucose Control. 2026.