Glycemic Load and Index: The Complete Guide to Blood Sugar Control

Most people trying to manage their blood sugar are using the wrong number.
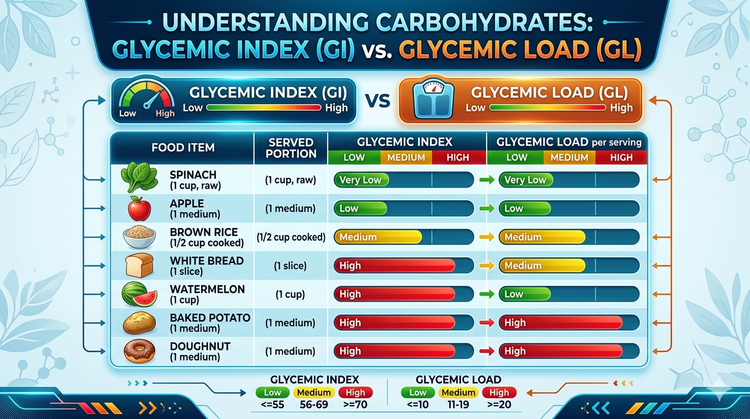
Glycemic index gets all the attention — but glycemic load is the metric that actually predicts what a food will do to your blood glucose in a real meal, at a real serving size. If you've ever been told to avoid watermelon because it's "high glycemic," you've seen what happens when GI is used without GL. This guide explains both numbers, shows you exactly how they work together, and gives you a practical framework you can use from your next meal onward.
What Is the Glycemic Index? (A Clear Definition)
The glycemic index (GI) is a numerical scale from 0 to 100 that measures how quickly the carbohydrates in a specific food raise blood glucose compared to pure glucose — which scores 100. The faster a food raises blood sugar, the higher its GI.
The scale was developed by Dr. David Jenkins at the University of Toronto in 1981 and has since been validated across thousands of foods by the University of Sydney Glycemic Index Research Service (SUGiRS), the world's most authoritative GI database.
GI Classification Table
| GI Category | Score Range | Examples |
|---|---|---|
| Low GI | 55 and below | Steel-cut oats, lentils, most fruits, milk, yogurt |
| Medium GI | 56 – 69 | Brown rice, whole wheat bread, sweet potato, pineapple |
| High GI | 70 and above | White bread, cornflakes, baked potato, white rice, watermelon |
GI testing is done under strict laboratory conditions: participants eat a portion of food containing exactly 50 grams of available carbohydrate, blood glucose is measured over 2 hours, and the result is plotted against a pure glucose curve. That last detail is the source of GI's biggest practical limitation — because nobody eats 50 grams of carbohydrate from a single food, in isolation, on an empty stomach.
That's the problem glycemic load was designed to solve.
What Is Glycemic Load? (And Why It's More Accurate)
Glycemic load (GL) takes the glycemic index of a food and multiplies it by the actual carbohydrate content of the portion you eat. This gives you the real-world blood sugar impact of a realistic serving.
The GL Formula
GL = (GI × grams of available carbohydrate per serving) ÷ 100
GL Classification
| GL Category | Score Range | What It Means |
|---|---|---|
| Low GL | 10 and below | Minimal blood sugar impact |
| Medium GL | 11 – 19 | Moderate, manageable impact |
| High GL | 20 and above | Significant blood sugar response |
According to research from the Harvard T.H. Chan School of Public Health, total daily glycemic load is a stronger predictor of long-term health outcomes — including type 2 diabetes risk, cardiovascular disease, and weight gain — than glycemic index alone.
A landmark 2021 meta-analysis published in The Lancet found that high dietary glycemic load was independently associated with a 12% increased risk of major cardiovascular events, even after adjusting for other dietary variables.
GL answers the question GI can't: how much of a glucose response will you actually get?
Glycemic Index vs Glycemic Load — Key Differences
The confusion between glycemic index and glycemic load is one of the most common mistakes in diabetes nutrition management. Here is the clearest way to understand the distinction:
GI tells you the speed. GL tells you the distance.
A sports car that reaches 200 mph in 3 seconds (high GI) is not dangerous if it only travels 20 metres (low GL). The same car driven for 400 kilometres (high GL) is a different matter entirely.
Side-by-Side Comparison
| Feature | Glycemic Index (GI) | Glycemic Load (GL) |
|---|---|---|
| What it measures | Speed of blood sugar rise | Total blood sugar impact per serving |
| Test portion | Always 50g available carbs | Realistic serving size |
| Considers portion size? | No | Yes |
| Formula | Standardised lab testing | GL = (GI × carbs) ÷ 100 |
| Practical use | Comparing carb quality | Planning real meals |
| Best for | Food selection | Meal planning and daily targets |
The Watermelon Example — The #1 Searched Confusion
Watermelon has a GI of 72 — firmly in the "high" category. This caused enormous confusion for years, with people avoiding watermelon as if it were as glycemically dangerous as white bread.
Now run the GL calculation:
- Watermelon GI: 72
- Available carbohydrate in a 120g serving: 6 grams
- GL = (72 × 6) ÷ 100 = GL 4.3 — very LOW
You would need to eat approximately 1.5kg of watermelon in a single sitting to generate a high glycemic load. In any realistic portion, watermelon is a low-GL food. GI alone would have told you the wrong thing.
The same paradox works in reverse: spaghetti has a GI of 46 — modest, middle-of-the-road. But a 180g serving contains 48g of carbohydrate, giving a GL of 22 — which is HIGH. A large bowl of pasta can hit you harder glycemically than most people expect, despite pasta's reputation as a "safe" low-GI food.
Why Glycemic Load and Index Matter for Your Health
Understanding both glycemic load and glycemic index isn't an academic exercise. The evidence linking these metrics to real health outcomes is substantial.
Blood Sugar Management and Type 2 Diabetes
A 2022 study in Diabetes Care confirmed that low-GI, low-GL dietary patterns significantly reduce HbA1c in people with type 2 diabetes. The American Diabetes Association (ADA) 2024 Standards of Care include glycemic index as a consideration in medical nutrition therapy for diabetes management.
For people with prediabetes, a low-GL dietary pattern has been shown to reduce the progression to type 2 diabetes by 36–58% depending on adherence — comparable to or exceeding the effect of first-line pharmaceutical intervention (metformin), according to the landmark Diabetes Prevention Program study.
Weight Management and Satiety
Low-GL foods tend to be digested more slowly, producing a more gradual glucose rise followed by a more sustained return to baseline. Research from Brigham and Women's Hospital (Harvard) published in the NEJM found that after initial weight loss, participants who followed a low-GL diet maintained their weight loss significantly better than those on a conventional low-fat diet — with less metabolic adaptation (metabolic slowdown) during restriction.
The mechanism: high-GL foods trigger a sharper insulin spike, which can paradoxically promote fat storage and accelerate the return of hunger. Low-GL eating keeps insulin lower, supporting both fat oxidation and sustained satiety.
Energy Levels and Mental Clarity
The post-lunch energy crash most people experience is directly related to a high-GL meal causing a rapid glucose rise followed by a reactive low. Cognitive function, attention, and working memory all show measurable impairment in the 2–3 hour window after a high-GL meal, according to research published in Nutritional Neuroscience. Switching to lower-GL meal patterns — particularly at breakfast and lunch — produces more stable cognitive performance across the day.
Heart Disease and Inflammation
High dietary glycemic load promotes inflammatory pathways through several mechanisms: elevated triglycerides, reduced HDL cholesterol, increased oxidative stress markers (particularly advanced glycation end products), and elevated CRP (C-reactive protein). The Lancet 2021 PURE study — 140,000 participants across 20 countries — found that a high glycemic load diet was independently associated with worse cardiovascular outcomes, regardless of total calorie intake.
Foods Ranked by Glycemic Index and Load — Complete Reference Guide
This table covers the most commonly consumed foods across all major categories, using validated values from the University of Sydney GI database and the American Journal of Clinical Nutrition international GI/GL tables (Atkinson, Foster-Powell & Brand-Miller, 2021).
| Food | GI Score | Serving | Carbs (g) | GL Score | Category |
|---|---|---|---|---|---|
| Chickpeas (canned) | 38 | 150g | 25 | 10 | 🟢 Low |
| Lentils (boiled) | 29 | 150g | 18 | 5 | 🟢 Low |
| Apple (raw) | 39 | 120g | 15 | 6 | 🟢 Low |
| Watermelon | 72 | 120g | 6 | 4 | 🟢 Low |
| Whole milk | 41 | 250ml | 12 | 5 | 🟢 Low |
| Steel-cut oats | 52 | 250g cooked | 22 | 12 | 🟡 Medium |
| Brown rice | 50 | 150g cooked | 32 | 16 | 🟡 Medium |
| Sweet potato (boiled) | 63 | 150g | 28 | 18 | 🟡 Medium |
| Banana (ripe) | 62 | 120g | 24 | 16 | 🟡 Medium |
| Sourdough bread | 52 | 60g (2 slices) | 27 | 14 | 🟡 Medium |
| White rice (short grain) | 89 | 150g cooked | 43 | 38 | 🔴 High |
| Baked potato | 111 | 150g | 30 | 33 | 🔴 High |
| Cornflakes | 93 | 30g | 25 | 23 | 🔴 High |
| White bread (2 slices) | 71 | 60g | 30 | 21 | 🔴 High |
| White spaghetti (al dente) | 46 | 180g cooked | 48 | 22 | 🔴 High |
| Instant oatmeal | 83 | 250g cooked | 26 | 30 | 🔴 High |
| Bagel (plain) | 72 | 70g | 35 | 25 | 🔴 High |
| Kidney beans (boiled) | 29 | 150g | 25 | 7 | 🟢 Low |
| Orange | 40 | 120g | 11 | 4 | 🟢 Low |
| Greek yogurt (plain) | 11 | 200g | 9 | 1 | 🟢 Low |
Note: A GI above 100 is possible — it indicates a food raises blood sugar faster than pure glucose, due to starch structure.
How to Use GI and GL in Your Daily Diet
Knowing the theory is only useful if you can translate it into practical meal decisions. Here is an evidence-based framework for applying glycemic load and glycemic index to your actual eating.
1. Set a Daily GL Target
Research supports the following daily GL thresholds:
- Low-GL diet: 100 or below per day
- Very low-GL (active metabolic management): 60 or below per day
- Typical Western diet: 160–250+ per day
Start by aiming below 100. Use a tracking tool or calculator to sum the GL of your meals until you develop intuitive sense of where common foods sit.
2. The Pairing Rule — Your Most Powerful Practical Tool
Every carbohydrate you eat becomes more glycemically manageable when paired with protein, fat, or fibre. These macronutrients slow gastric emptying, meaning glucose enters your bloodstream more gradually. The effective GL of the entire meal drops — not just the carbohydrate component.
High-GL alone: White rice (plain bowl) → GL 38, sharp spike.
Low-effective-GL paired: White rice + grilled chicken + broccoli + olive oil → effective glucose response significantly blunted.
3. Eat Carbohydrates Last in a Meal
Multiple randomised controlled trials confirm that eating vegetables and protein before carbohydrates reduces postprandial (after-meal) blood glucose peaks by 20–40% compared to eating carbohydrates first. This food-sequencing approach is one of the most underused and zero-cost interventions in blood sugar management.
4. Leverage Cooking Methods
Cooking method dramatically changes GI — and therefore GL:
- Cooling cooked rice or potato overnight increases resistant starch content, lowering GI by 25–35%
- Al dente pasta (firm, slightly undercooked) has a GI of ~46; the same pasta boiled soft rises to ~61
- Whole grain vs refined processing changes both carbohydrate density and fibre content, affecting GL
5. Pre- and Post-Exercise Nutrition
Before moderate-to-intense exercise: a low-to-medium GL meal 2–3 hours prior supports sustained energy without a mid-workout glucose crash.
After strength or high-intensity training: a moderate-GL carbohydrate source (GL 15–25) with protein within 60–90 minutes supports glycogen replenishment and muscle protein synthesis. The post-exercise window is one of the few situations where a higher GI carbohydrate is physiologically appropriate.
6. Think Whole Dietary Pattern, Not Single Foods
The power of the glycemic load framework is greatest when applied to the entire diet, not individual foods in isolation. A single high-GL meal does not define your metabolic health. The cumulative daily and weekly glycemic load — combined with total fibre intake, physical activity, sleep quality, and stress management — determines your long-term blood glucose trajectory and HbA1c.
Common Myths About Glycemic Index — Debunked
Myth 1: All High-GI Foods Are Unhealthy
False. As the watermelon and carrot examples demonstrate, a high GI score tells you nothing about portion-specific blood sugar impact, nutritional density, or overall health value. Carrots have a GI of ~47 and a GL of just 2 per 80g serving. Parsnips are similar. These are nutrient-dense vegetables that were avoided for decades based on GI misapplication.
Myth 2: Diabetics Must Avoid All Carbohydrates
The ADA does not recommend eliminating all carbohydrates. The evidence supports reducing glycemic load — which can be achieved through portion control, smart food choices, strategic pairing, and cooking method adjustments — not the elimination of entire macronutrient groups. Low-carbohydrate diets are one valid approach but are not the only evidence-based option.
Myth 3: Glycemic Index Is the Same for Everyone
GI values are population averages. Individual glycemic response to identical foods can vary by 20–40% between people, and by 10–25% in the same person across different days — based on gut microbiome composition, stress levels, sleep quality, time of day, and the other foods consumed. Continuous glucose monitors (CGMs) reveal this personal variability in real time.
Myth 4: Brown Rice Is Always Better Than White Rice
For GL purposes, the difference is less dramatic than commonly believed. Brown rice (GL 16 per 150g) versus white rice (GL 38 per 150g) is a meaningful difference — but cooling white rice overnight (GL ~18 per 150g) partially closes that gap. Serving size, pairing, and cooking method matter more than the colour of the grain.
Glycemic Index and Load for Specific Groups
People With Type 1 or Type 2 Diabetes
Glycemic load is an essential planning tool for insulin dosing and postprandial glucose management. For type 2 diabetes, adopting a low-GL dietary pattern (daily GL below 100) has been shown to reduce HbA1c by 0.4–0.5% over 12 weeks in well-controlled trials — a clinically meaningful reduction. The ADA recommends individualised meal planning incorporating glycemic index as one component of medical nutrition therapy. Always work with your physician or registered dietitian to adjust medication alongside dietary changes.
People Trying to Lose Weight
Low-GL diets support weight loss through two mechanisms: lower insulin stimulation (reducing fat storage signals) and greater satiety per calorie consumed. A 2022 BMJ systematic review found that low-GL dietary patterns produced comparable weight loss to low-fat diets but with better adherence and less metabolic adaptation at 6 and 12 months.
Athletes and Active Individuals
Athletes require higher total carbohydrate intake to support performance and recovery. The glycemic index becomes particularly relevant around training: low-to-medium GI sources for pre-training energy and moderate-to-higher GI sources post-training for rapid glycogen replenishment. During endurance events exceeding 60 minutes, high-GI carbohydrates are actively beneficial — this is the correct context for sports gels, bananas, and similar fast-acting sources.
Pregnant Women
Gestational diabetes management increasingly incorporates low-GL dietary approaches. A systematic review in Diabetologia found that low-GI diets in pregnancy reduced the risk of large-for-gestational-age babies and decreased the need for insulin therapy in gestational diabetes. Pregnant women should work with their obstetric team before making significant dietary changes.
Limitations of the Glycemic Index System
Individual Variability Is Significant
As noted above, GI values are averages. The same individual can show 25% variation in glycemic response to the same food on different days. This variability is one reason the GI/GL framework is a useful guide, not a precise clinical instrument.
Cooking Method and Ripeness Change the GI
The GI of a banana changes from ~30 (unripe, green) to ~62 (fully ripe) as starches convert to sugars during ripening. Pasta cooked 5 minutes longer than al dente can jump 15 GI points. These real-world variations are not captured in published GI tables.
Food Combinations Alter Glycemic Response
GI/GL values are measured for single foods eaten in isolation. Combining foods — as in any real meal — changes the glycemic response in complex ways. Adding vinegar, lemon juice, or fermented foods to a meal lowers the postprandial glucose response. Adding fat and protein always blunts the glucose curve. The published GI of a food is always a starting point, not an absolute prediction of your blood sugar response.
The Whole Dietary Pattern Matters More Than Any Single Food
Harvard research, the PREDIMED Mediterranean diet trial, and the PURE study all confirm that overall dietary quality — total fibre intake, food diversity, degree of processing, and caloric balance — predicts metabolic and cardiovascular outcomes far better than any single food's GI or GL score. Using GI/GL to guide food choices within a high-quality, whole-food-based dietary pattern is the evidence-supported approach. Using it to justify ultra-processed foods with low GI scores (some confectionery and ice cream are medium-GI) misapplies the tool entirely.
The Bottom Line
- Glycemic index tells you how fast a carbohydrate raises blood sugar. Glycemic load tells you how much it actually raises it in a real portion — making GL the more useful number for everyday decisions.
- The GL formula is simple: (GI × grams of available carbohydrate) ÷ 100. A GL below 10 is low; 11–19 is moderate; 20+ is high.
- Watermelon is safe in normal portions despite its high GI — a perfect demonstration of why GI without GL is an incomplete picture.
- Low-GL eating — daily total below 100 — is supported by strong evidence for reducing HbA1c, supporting weight loss, improving satiety, and lowering cardiovascular risk.
- The most powerful practical tools: pair carbohydrates with protein and fat, eat carbs last in a meal, leverage cooking methods (cool your rice, cook pasta al dente), and think in terms of daily total GL rather than individual food scores.
Both glycemic load and index are tools, not verdicts on individual foods. Used together, and placed within the context of overall dietary quality, they form one of the most evidence-based, practical frameworks available for managing blood sugar, energy, and long-term metabolic health.
Frequently Asked Questions
Q: What is glycemic index and glycemic load? A: Glycemic index (GI) measures how fast a food raises blood sugar on a scale of 0–100. Glycemic load (GL) multiplies GI by the actual carbohydrate grams in your serving and divides by 100, giving you the real-world blood sugar impact per portion.
Q: How do you calculate glycemic index and glycemic load? A: GI is measured in laboratory conditions — participants eat a 50g carbohydrate portion and blood glucose is tracked for 2 hours. GL you can calculate yourself: GL = (GI × grams of carbohydrate in your serving) ÷ 100.
Q: What is the difference between glycemic index and glycemic load? A: GI measures the speed of blood sugar rise from a standardised 50g portion of carbohydrate. GL accounts for realistic portion size and measures total blood sugar impact — making it far more practical for meal planning.
Q: What is the difference between glycemic load and glycemic index? A: They measure related but different things. GI tells you how fast a carbohydrate acts; GL tells you how much of that action you actually get in the portion you eat. Low-GL is the more actionable metric for daily diet decisions.
Q: What is the difference between glycemic index and load? A: GI = carbohydrate quality (speed). GL = carbohydrate quality × quantity (total impact). GL is calculated as (GI × serving carbs) ÷ 100.
Q: What is glycemic load and index in simple terms? A: GI is like a car's top speed. GL is how far it actually travels. A car that goes fast but stops quickly (high GI, small portion = low GL) has less overall impact than a slower car on a long journey (medium GI, large portion = high GL).
Q: What does glycemic index and glycemic load mean? A: GI means: how quickly will this food raise my blood sugar? GL means: how much will this food actually raise my blood sugar given how much I'm eating?
Q: What's the difference between glycemic index and glycemic load? A: GI is a fixed property of a food. GL changes based on how much you eat. Watermelon has a high GI (72) but a very low GL (4) in normal portions — the perfect example of why you need both numbers.
Q: What's the difference between glycemic load and glycemic index? A: Glycemic load is the more clinically useful metric because it factors in portion size. Glycemic index tells you how a food behaves under laboratory conditions; glycemic load tells you what it will do in your actual meal.
Q: Do glycemic index and load charting help diabetes? A: Yes — clinical research consistently shows that tracking and reducing dietary glycemic load improves HbA1c, fasting glucose, and postprandial blood sugar in both type 1 and type 2 diabetes. The ADA includes GI/GL guidance in its Standards of Medical Care in Diabetes.
Q: What is a glycemic index and glycemic load chart? A: It is a reference table listing foods alongside their GI score, typical serving size, carbohydrate content, and calculated GL score. The reference table in this article covers 20 of the most commonly consumed foods across all major categories.
Q: What is a glycemic index and glycemic load diet? A: A dietary approach that prioritises foods with low-to-medium GI scores in portions that keep daily glycemic load below 100. It focuses on legumes, non-starchy vegetables, whole grains, dairy, and most fruits — while limiting refined carbohydrates, processed foods, and large portions of high-GI staples.
Q: What is more important — glycemic index or glycemic load? A: Glycemic load is more important for practical meal planning because it accounts for portion size. GI is useful for comparing foods of similar type. Most nutrition scientists and dietitians consider GL the more clinically relevant metric for managing blood sugar and planning meals in real life.
Q: What is true about glycemic index and glycemic load? A: Both measure blood sugar response to carbohydrates, but GL is the more complete measure. GI is fixed per food; GL changes with serving size. Both are averages — individual responses vary. And neither replaces the importance of overall dietary quality, fibre intake, and food processing level.
Q: Which foods have the lowest glycemic index and load? A: Foods with both low GI and low GL include: lentils (GI 29, GL 5), chickpeas (GI 38, GL 10), most raw fruits (apples GI 39, GL 6; oranges GI 40, GL 4), non-starchy vegetables (virtually all GL below 5), plain Greek yogurt (GI 11, GL 1), and whole milk (GI 41, GL 5).
Q: What is the glycemic index and glycemic load? A: Glycemic index is a 0–100 scale of how fast a food raises blood sugar. Glycemic load is a calculated score (GI × carbs ÷ 100) that tells you the total blood sugar impact of a realistic serving. Together, they give a complete picture of a food's glycemic effect.
Written by Dr. Bilal Khalid (M.D.), Physician and Metabolic Health Specialist. Dr. Khalid reversed a personal HbA1c of 14.2% to 5.3% in 75 days
using evidence-based dietary and lifestyle intervention. All content is reviewed against peer-reviewed literature and current clinical guidelines. This article is for educational purposes and does not constitute personal medical advice.